

Important changes in societal economic philosophy and policies occurred in the United States during the 1980s, after a transition period covering the Carter Administration, and accelerating after the accession of Ronald Reagan to the Presidency. It’s now nearly three decades later, and we can ask how well the transition from Keynesianism to Neo-liberalism has worked. It’s common knowledge that this period has seen wage stagnation for working Americans, and also growing inequality. In this post I want to present a simple table showing certain changes in key indicators across the decades and discuss its significance for evaluating the performance of neo-liberalism compared to the earlier Keynesian orientation and policies. Here’s the Table.
Table: Percent Changes in Some
Key Indicators Across the Decades
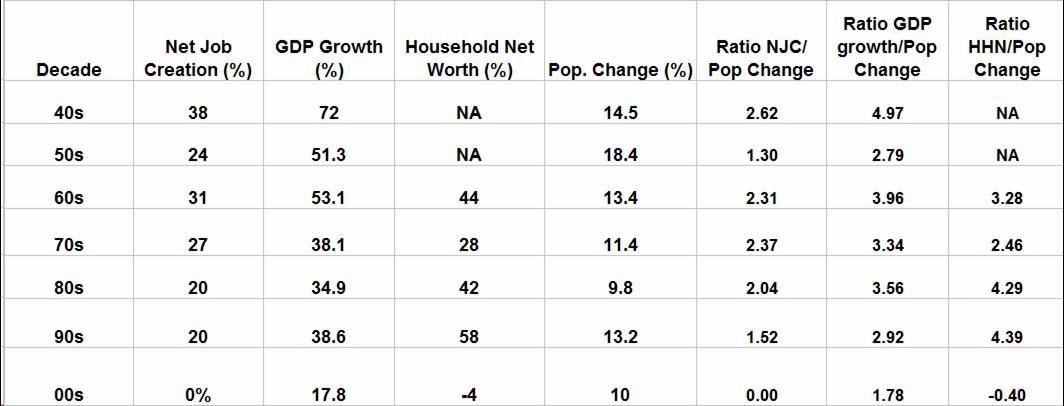
The first four columns in the table were taken from Neil Irwin’s recent article emphasizing that the first decade of the 21st Century was a lost decade for the US economy and its workers. I added the last four columns, myself. All the numbers in the Table are percent changes, or ratios of percent changes during each decade beginning in 1940. I took the percent population change column from the US Census Bureau via Wikipedia, and then calculated the ratios in the last three columns.
The first thing that leaps out at you when looking at the table is that the last three neo-liberal decades generally show a substantial decline in percent growth in net job creation compared to the first four decades when Keynesian economic policies were much more prevalent. In percent GDP growth across the decades there are high levels of percent change in the first three decades, then mid-level percent changes in the Nixon-Ford-Carter, Carter-Reagan-Bush 41, and Bush 41-Clinton decades, and then a decline to an unprecedentedly low level in the Clinton-Bush 43-Obama decade. The neo-liberal period certainly seems to be characterized by lower growth in GDP, than the earlier Keynesian period.
The third column, which unfortunately is missing data for the first two decades, seems to suggest that growth in Household Net Worth was high during the ’60s, ’80s, and ’90s, but lower in the ’70s, and lowest of all in the last decade where it goes negative. This suggests that Household Net Worth is less strongly correlated with job growth and GDP growth, and, instead is dependent on trends in residential real estate, which may have much to do with how the financial industry is operating, and whether it’s providing credit to those interested in buying houses. Credit was freely available in the ’60s, ’80s, and 90s, but in both the ’70s and the “aught” decade of this century, credit needed to buy real houses became severely constrained in the latter part of the two decades, and the result was slower appreciation, or even a crash in real estate values in the last few years, which explains the decline in growth of Household Net Worth in the last part of the Carter Administration, and also the collapse in growth of Household Net Worth during the “aught” decade.
In brief, the first four columns of the table may suggest that percent growth in both net job creation, and in GDP were much greater under Keynesianism, than under neo-liberalism, but that growth in Household Net Worth can be great in either Keynesian or neo-liberal periods, with the qualification, however, that the negative changes in Household Net Worth in the “aught” decade suggests that neo-liberal economic regimes are more subject to the possibility of sharp collapses than Keynesian regimes are. In other words, the record of the last 30 years suggests that for some decades neo-liberalism may provide strong growth in Household Net Worth, but then may be subject to a substantial collapse where gains in Household Net Worth are partially wiped out when credit collapses occur.
Looking at the population column in the table, the ’40s, ’50s, and ’60s were a period of high population growth. A decline in birth rates caused growth to decline somewhat in the ’70s, and over the next three decades growth in population was up and down, driven by trends in immigration rather than birth rate among previous US residents, but was generally lower than it had been in the first three decades. Now let’s turn to the last three columns.
These are really interesting because the ratios adjust percent changes relative to percent changes in population. First, we see that in the first four decades, the changes in net job creation outrun the growth in population by a substantial amount with the exception of the decade of the ’50s, when net job creation outpaced population growth by a lesser amount. However, once neo-liberalism really accelerates in the ’80s we see a trend toward lower rates of net job creation relative to population growth, until in the last decade, the ratio falls to zero.
Second, when we move to the GDP change to population change ratio, we see generally high levels of the ratio, except for the ’50s, through the 1980s, but then a sharp and sustained decline during the past two decades with the last decade falling to the unprecedentedly low ratio of 1.78, by far the lowest ratio in the table.
Third, while the pattern of change is obscured by the absence of data on percent change in Household Net Worth in the first two decades, the results suggest that neo-liberal economics provides a much higher ratio of percent change in Household Net Worth to percent change in population than does Keynesian economics, provided that there is no collapse of its bubble real estate economy, as occurred in the “aught” decade. Also, this gain in rapidity of increase in Household Net Worth occurs alongside a slowing of growth in both GDP and Net Job Creation, relative to population, suggesting that increasing labor market competition, and flat or declining wages in the job market, can be accompanied by increases in Household Net Worth relative to population increases, until, of course, the neo-liberal economic boom ends, when growth in Net Job Creation, GDP, and Household Net Worth all collapse along with the boom, and the gains made in Household Net Worth are lost on the average.
So, what’s the lesson of this table? I think it is that the neo-liberal economic regime represents both a return to the boom-bust cycles of pre-keynesian economics when it comes to percent changes in Household Net Worth, while it also delivers both cyclic behavior and lower levels of Net Job Creation, and GDP growth even during its booms. Taking into account also the prevalent statistics showing the great growth in inequality in the United States since 1970, it’s hard to deny that neo-liberalism is the cause of gradual impoverishment of working Americans over a long period of time. The trends suggest that, as an economic regime, neo-liberalism is bad for the United States, and also that the economic regime preceding it, with its greater component of Keynesianism was much more effective at delivering the American Dream. Does that suggest we ought to return to Keynesianism?
Not exactly, I think. Lately, Keynesian macroeconomics is being challenged by a school called Modern Monetary Theory (MMT), or Chartalism, which in loose terms may be thought of as Keynesianism on steroids. I won’t summarize the main tenets of this school here, but have written about it previously, here, here, and here, and will be doing so again in the future. Here I’ll just say that Chartalism makes good sense to me and that it suggests that we can move to rebuild the American economy immediately without undue worry about inflation or the size of the national debt, or Budget deficits. Chartalism suggests a much more activist Government than we have, a Government that can, once again, address the problems of economic suffering, despair, inequality, and lack of social justice that threaten to destroy the character and identity of America, and make of us a gray empty land of angry and hopeless people.
We don’t hear much anymore about “the audacity of hope,” or “yes we can.” That kind of talk seems to have gone away with the President’s embrace of the Reagan-Rubin-Greenspan model of neo-liberalism. It’s time to recognize that Chartalism and Modern Monetary Theory are the economic face of hope, as well as the economic embodiment of the rapidly vanishing spirit of “yes we can,” that we will need to take our country back from the corporatists, the globalists, and the banksters, who have been destroying our economic lives, our independence, our futures, and the hopes of ourselves and our children.
(Also posted at firedoglake.com and Correntewire.com where there may be more comments)